
Welcome to Course 7.3 of Walbi Academy, where we're demystifying the world of technical analysis. In the fast-paced realm of crypto trading, understanding price charts and predicting market movements can be the difference between a successful trade and a missed opportunity. Technical analysis is your toolkit for decoding these charts, using patterns and indicators to identify potential entry and exit points.
Today, we'll focus on:
- Chart patterns,
- the visual language of the market,
- and how mastering them can equip you with practical skills to make informed trading decisions.
By the end of this lesson, you'll see how Walbi's powerful charting tools can transform your analysis, making it easier than ever to spot trends and execute your strategies with confidence. Let's dive in and unlock the secrets hidden within the charts!
Decoding the Language of Charts
Technical analysis is like learning a new language – the language of price charts. To speak it fluently, you need to understand key concepts like
- chart patterns,
- technical indicators,
- and trading volume indicators.
Chart patterns are visual formations on a price chart that can signal potential future price movements. Imagine spotting a "head and shoulders" pattern; this could suggest a potential reversal in the current trend.
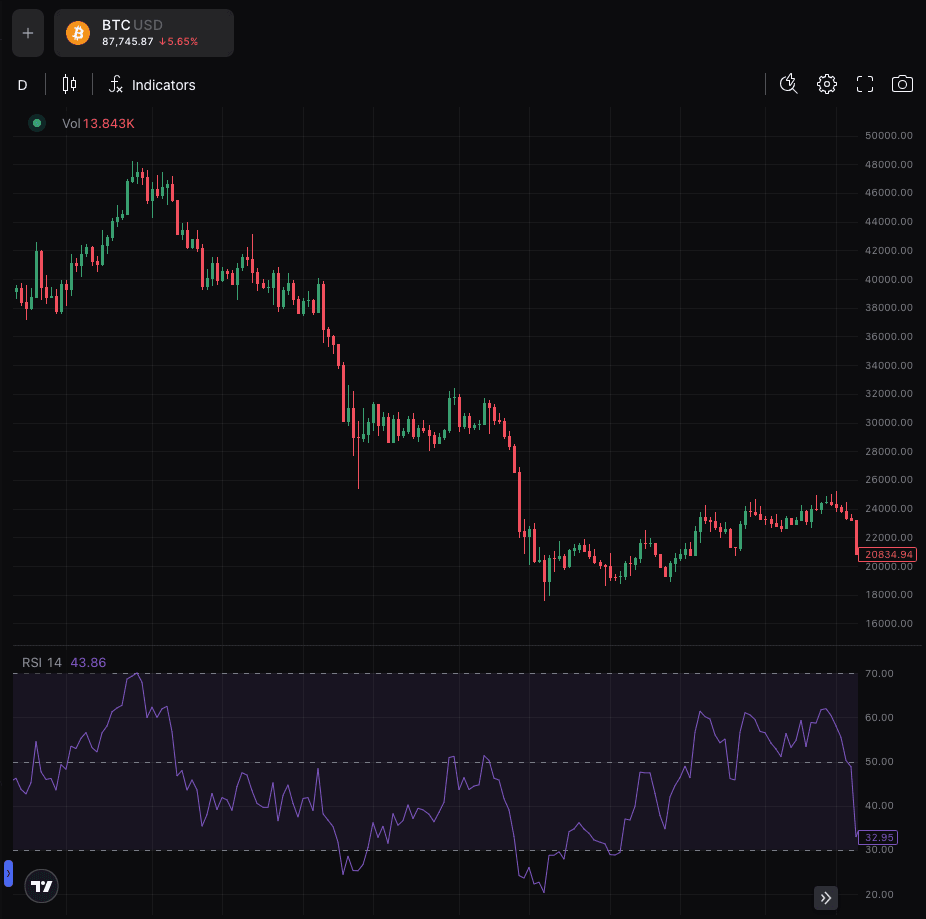
Technical indicators, on the other hand, are mathematical calculations based on price and volume data. For example, the Relative Strength Index (RSI) can help identify overbought or oversold conditions, giving you clues about when to buy or sell.
Lastly, trading volume indicators, like the On-Balance-Volume (OBV), show the strength of a trend by analyzing how much trading activity is behind price movements. These elements work together to help traders make informed decisions by providing insights into market sentiment and potential price direction.
Technical vs. Fundamental: A Quick Overview
It's important to understand how technical analysis differs from fundamental analysis. While technical analysis focuses on price charts and historical data to predict future price movements, fundamental analysis examines the underlying value of an asset.For instance, in the stock market, fundamental analysts might look at a company's earnings, revenue, and management team.
Suggested Reading: Course 7.2 - Fundamental Analysis Deep Dive
In the crypto world, this translates to analyzing
- blockchain technology,
- team roadmaps,
- and tokenomics.
Think of it this way: technical analysis is like reading the weather forecast, while fundamental analysis is like understanding the climate. Both are valuable tools, and many successful traders use a combination of both to make well-rounded investment decisions.
Spotting the Direction: Why Trends Matter
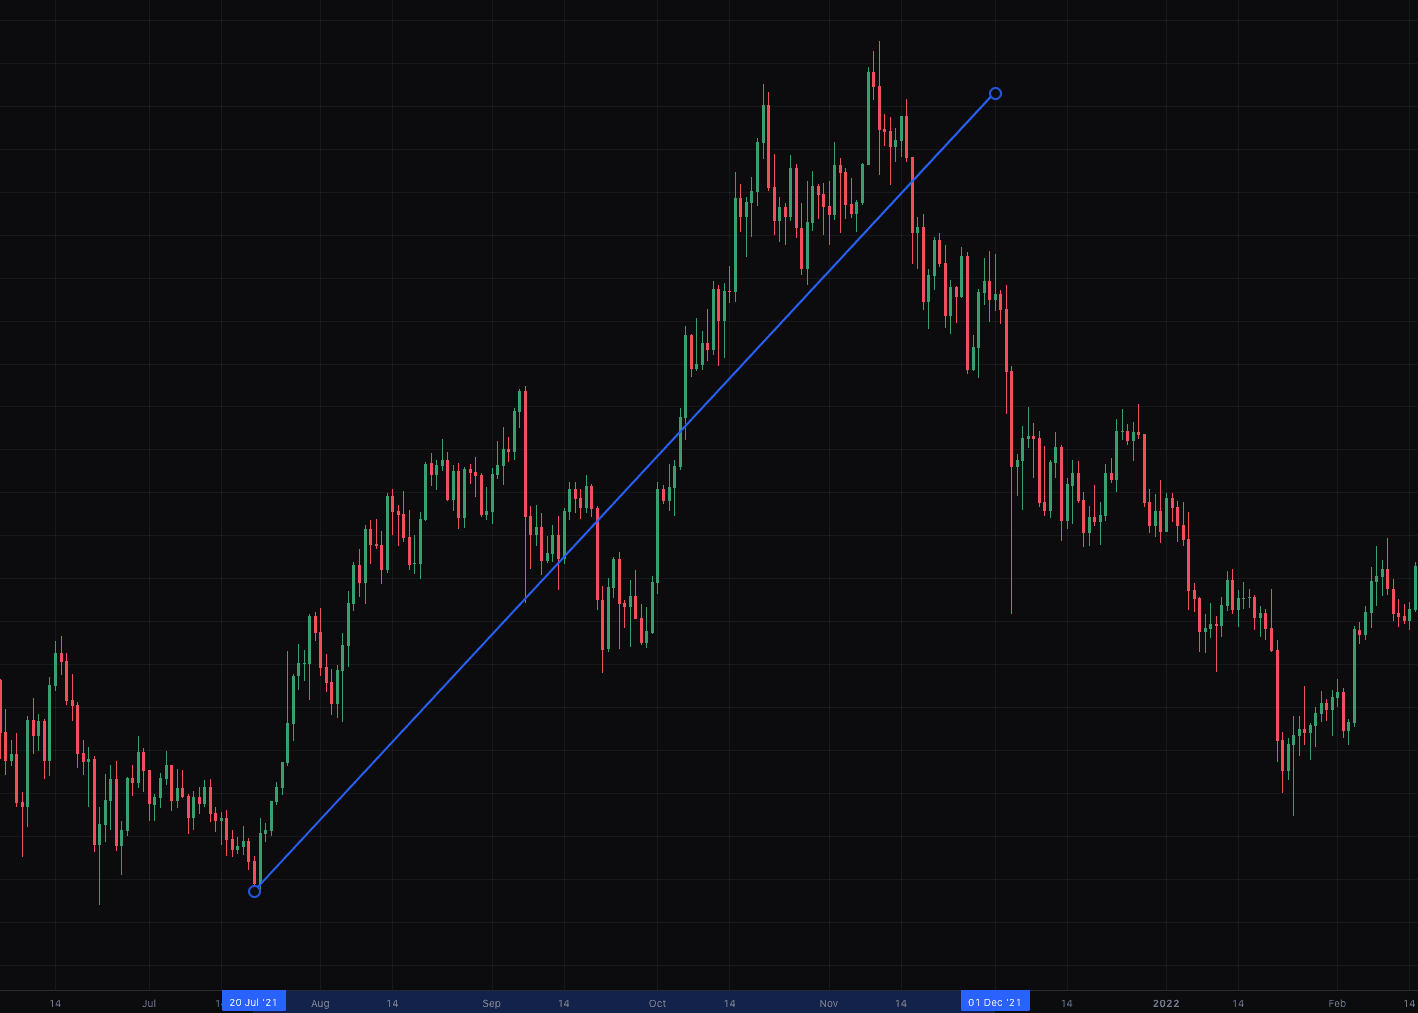
In the world of trading, "the trend is your friend." Identifying trends on price charts is crucial because it gives you a sense of the market's overall direction. An uptrend, marked by higher highs and higher lows, suggests that buyers are in control, while a downtrend, with lower highs and lower lows, indicates sellers are dominating.
Recognizing these trends allows you to align your trades with the prevailing market momentum. For instance, if you spot an uptrend, you might look for opportunities to buy on dips, riding the wave upward.
Conversely, in a downtrend, you might consider selling or shorting, profiting from the market's decline. Understanding trends helps you avoid trading against the market, which can lead to significant losses.
Finding the Walls: Support and Resistance
Support and resistance levels are like invisible walls on a price chart. Support levels are price points where buying pressure is expected to outweigh selling pressure, preventing the price from falling further.
Resistance levels are the opposite, where selling pressure is expected to halt the price from rising. To identify these levels, look for areas where the price has repeatedly bounced off or struggled to break through. For example, a "head and shoulders" pattern often signals a potential reversal at a resistance level, while "triangles" and "flags" can indicate consolidation periods within a trend, with potential breakouts at support or resistance. Visual examples on a chart make these concepts much clearer. By identifying these levels, you can set stop-loss orders to limit potential losses and take-profit orders to lock in gains, making your trading more strategic and less emotional.
Alright, let's craft those paragraphs to highlight Walbi's charting tools and indicators:
Unlock Insights with Walbi's Charting Power
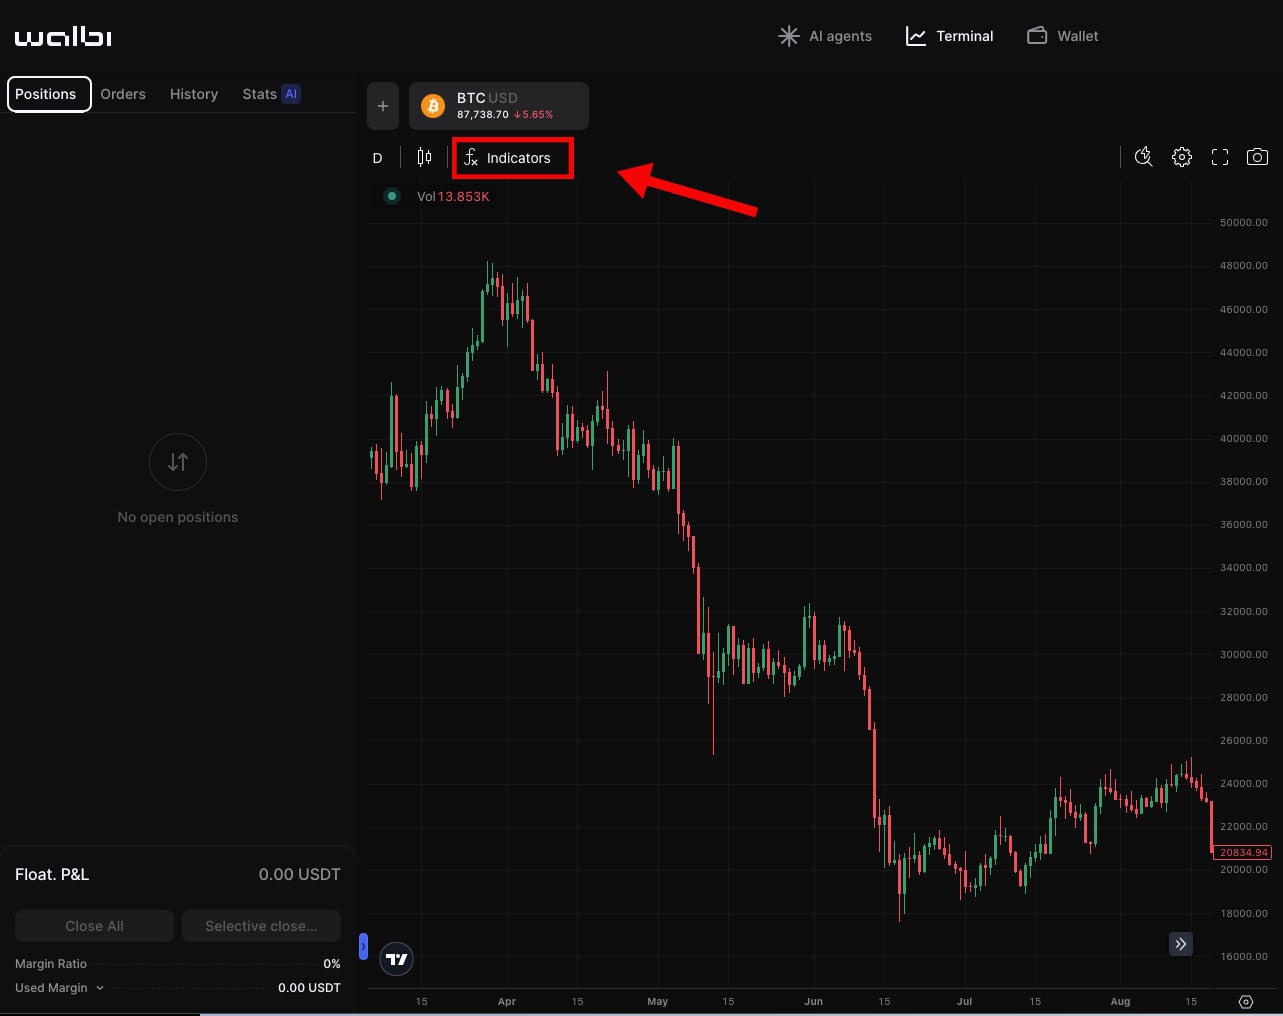
Walbi's platform offers a suite of advanced charting tools designed to empower your technical analysis. Navigating these tools is straightforward. Once you've selected your desired trading pair, you'll find an array of customizable charts, allowing you to view price action across various timeframes.
To access integrated technical indicators, simply click the "Indicators" button located on the chart interface. You'll discover a comprehensive list of indicators, from moving averages and RSI to MACD and Bollinger Bands.
Select the indicators you wish to apply, and they will overlay directly onto your chart. For instance, to use the Relative Strength Index (RSI), search for "RSI," click it, and observe how it visualizes overbought and oversold conditions. Similarly, trading volume indicators like the On-Balance Volume (OBV) are readily available, providing vital confirmation of price trends by showing the strength of buying or selling pressure.
Enhance Your Analysis: Putting Indicators to Work
These tools significantly enhance your market analysis by providing real-time data and visual cues that help you identify potential trading opportunities. For example, by combining moving averages with RSI, you can confirm trend direction and potential reversal points. Walbi's platform also allows you to customize indicator settings, tailoring them to your specific trading style and strategies.
Furthermore, you can save your preferred chart layouts and indicator combinations, streamlining your analysis process. By using these tools, you can avoid emotional trading and make more data-driven decisions.
Now, it's your turn! We encourage you to log in to your Walbi account and experiment with the various technical indicators. Try applying different combinations and observing how they interact with price action. This hands-on experience will solidify your understanding and build your confidence in using these powerful tools.
Test Before You Trade: Backtesting with Walbi
Backtesting is like a test run for your trading strategies. It involves applying your chosen technical analysis rules to historical price data to see how they would have performed in the past. This process is crucial because it allows you to evaluate the effectiveness of your strategies without risking real capital. On Walbi, backtesting is made simple. You can define your trading rules, such as:
"buy when the RSI crosses below 30 and sell when it crosses above 70,"
and then apply these rules to historical price charts. Walbi's platform will then show you the potential profit or loss you would have made using this strategy over a specific period. For example, you might find that this simple RSI strategy yielded a 15% profit over the last month on the BTC/USD pair. This helps you refine and optimize your strategies, ensuring they have a higher probability of success when you trade live.
Your Journey Continues: Practice and Adapt
In this lesson, we've explored the fundamentals of technical analysis, focusing on chart patterns, indicators, and the power of backtesting. Remember, mastering these concepts takes practice. We encourage you to use Walbi's tools to apply what you've learned and refine your skills. The crypto market is dynamic, and continuous learning is essential for success. Don't be afraid to experiment with different strategies and adapt to changing market conditions. By combining knowledge with practical experience, you can build a solid foundation for your trading journey. Keep learning, keep practicing, and keep adapting – your success in the crypto market depends on it.